BALTRAD
1. Algorithm name
Precipitation accumulation - ACRR
2. Basic description
a) Physical basis of the algorithm
Derive an accumulated precipitation product based on a set of input reflectivity products, either single-site or, more likely, composite.
b) Amount of validation performed so far
Prototype developed and tested for OPERA.
c) References (names and contact information of all developers during the evolutionary history, scientific papers)
Sort-of based on the method used at the BALTEX Radar Data Center, but in new form.
3. ODIM metadata requirements for I/O
Input
gain, offset, nodata, and undetect for reflectivity datasets
how/task = se.smhi.composite.distance.radar for surface distance quality indicator fields
gain and offset for the surface distance QI fields
Output
Output physical parameter must have what/quantity=ACRR
what/prodpar of the ACRR dataset must be set to the integration period (hours)
Otherwise, metadata are the same as for input data, just that gain and offset will need to be adjusted.
4. Input data
a) What kind of radar data (including the list of previous algorithms and quality flags applied)
Reflectivity data are the most relevant: normally DBZH, but also TH. It’s probably unlikely that someone would want to accumulate TV or DBZV, but we might support them too. We don’t have much of a tradition of storing data as RATE (mm/h), so these may be considered less relevant and not supported.
It is assumed here that the fixed R(Z) conversion of this algorithm is applied only until the dynamic only conversion is available. If dynamic R(Z) conversion is applied then it is recommended that the conversion and the accumulation are split in two separate algorithms.
Data can be in any stage of quality. Optionally, a quality indicator dataset containing surface distance from the radar, that accompanies a reflectivity field, can be used to derive an average distance field that will accompany the output ACRR result.
Otherwise, it doesn’t make sense to make the accumulator somehow average all the various forms of quality indicators we may produce, at least not without careful consideration that we won’t deal with in this first version.
b) Other data (optional and mandatory, applying “universally” agreed formats, geometry)
None
5. Logical steps, using any of: text, flow charts, graphics, equations (or references to equations), conditional branches in “all possible cases”.
Required arguments
| Information | Type |
| Input data | List of file names |
| Nominal date | YYYYMMDD according to ODIM |
| Nominal time | HHmmss according to ODIM |
| Nr. hours | float |
| Images per hour | integer |
| Proportion accepted | float (0-1), e.g. 0.95 for 95% |
| A coefficient in Z-R | float |
| b coefficient in Z-R | float |
Algorithm
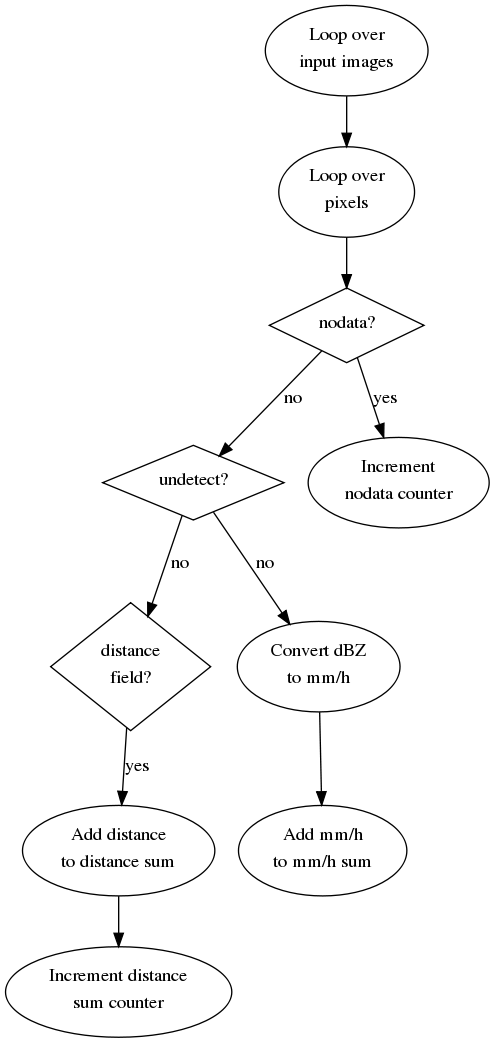
It’s a two-step process. Step 1 involves looping through all input images and determining the sum of all the precipitation intensities in the time series. If the surface distance QI field exists, also sum the distances.
A couple of notes on determining input data:
- The total number of input files in the time series is (nr.hours)*(images per hour)+1. For example, if we have an image every 15 min, there will be five images for a one-hour accumulation.
- The scheduler (Beast) will have to find input data based on the nominal date/time which is always the end of the integration period.
It’s important to use counters to keep track of how many hits in the time series there are. This will be used in step 2 to accept or reject results. Step 1 can be illustrated schematically as follows.

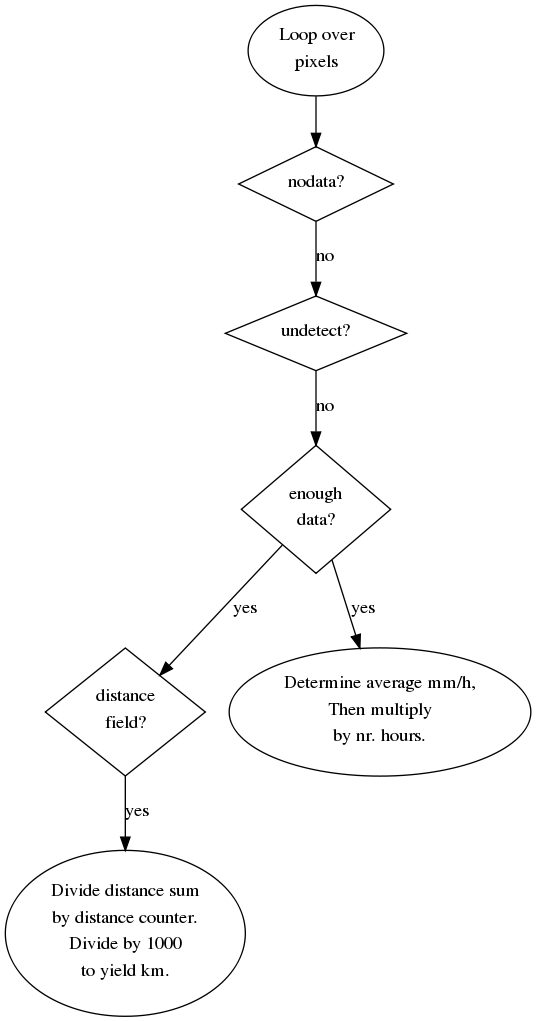
Step 2 takes the results of step 1 and loops one last time, using the counters to derive ACRR results and, optionally, an associated mean distance QI field. Schematically, this is:

6. Output
The result is an ODIM_H5 file containing a composite with an ACRR quantity and, optionally, an associated average surface distance quality indicator field.
a) Data type using ODIM notation where possible, e.g. DBZH
ACRR
b) Added quality indicators
With how/task = se.smhi.composite.distance.radar
7. Outline of a test concept exemplifying the algorithm, as a suggestion for checking that an implementation has been successful.
Using 2x2 arrays, two containing raw pixel reflectivity values and two containing corresponding surface distance data:
Dataset 1:
dBZ
| nodata | 111 | |
| 111 | undetect |
distance
| 0 | 0 |
| 25 | 50 |
Dataset 2:
dBZ
| nodata | 111 |
| undetect | 111 |
distance
| 0 | 100 |
| 50 | 100 |
Accumulating these two datasets should give the following results, assuming gain=0.5, offset=-32.5, zr_a=200, zr_b=1.6:
ACRR
| nodata | 1.0 |
| 0.5 | 0.5 |
distance
| 0 | 100 |
| 50 | 100 |