BALTRAD
1. Algorithm name
Non-polarimetric integrated path attenuation estimate for melting layer at C-band - BBAND_ATTN_DIAG_SPOL_fmi
2. Basic description
a) Physical basis of the algorithm
The intensity and depth of a melting layer is dependent on the primary particle habit before the melting process at the top of layer. In addition to environmental conditions such as updraft, relative humidity and temperature profile, the habit influences strongly to the layer characteristics and therefore to the attenuation it causes for the radar signal. Hence also the attenuation correction must be defined as function of primary habit. In this proposed recipe the path integrated attenuation estimate (PIA) of a melting layer is defined separately for low-density aggregates and for more dense rimed particles. This estimate considers only stratiform cases with a clearly observed bright band.
The attenuation estimate is based on a melting layer model, which parameters for snow particle density and snow terminal velocity at the top of the melting layer, is constrained with vertical pointing Doppler C-band radar measurements. In the research, two events were selected to be presentative for unrimed and rimed stratiform melting layer cases and the optimized parameter values were found by fitting the modeled and measured reflectivity factor and reflectivity-weighted fall velocity. Initial guesses for the parameters were taken from the literature and the fitting process was constrained with barrier functions to prevent the gained values to be unphysical. The temperature profile, which controls the melting process, was acquired from measured sounding data, and the gamma DSD parameters of rain were obtained from disdrometer measurements. Different mixing models for defining the permittivity of the melting particles were studied as it is known that the scattering characteristics are strongly dependent on chosen model. The scattering calculations were performed with analytical solution for spheres, so no canting effects could be modeled and therefore also no polarimetric properties. With the optimized snow particle density and velocity values the melting layer model was driven with 996 stratiform rain cases measured with a disdrometer. The estimated integrated specific attenuation as a function of maximum reflectivity factor in the melting layer and as a function of rain rate below the melting layer were defined for both unrimed and rimed case separately. Although the attenuation is strongly dependent on the melting particle habit, utilizing the estimated relation defined as function of maximum reflectivity inside the melting layer, the relations for unrimed and rimed are similar. Noteworthy is that these don’t correspond to same intensity of rain and this can be seen in the A-R relations for both snow cases. The attenuation depends not only on the vertical profile of the reflectivity in a melting layer, but also on the measurement geometry. Our recommendation is that this attenuation estimate is not mature enough for quantitative correction, but can be applied e.g. for defining weighting in a qualitative radar composite.
The gained A-z-relations are for unrimed snow
for rimed snow
As this estimate doesn’t consider the geometry and the propagation effects of the radar beam through the relatively thin melting layer (approx.500 m), the proposed path-integrated attenuation estimate can be applied only to cases, where the radar signal travels a long distance inside the melting layer. At high latitudes these situations occur for the low elevation scans, when the melting layer is located just above the ground level. In Finland this is around 5% of all precipitation cases [Pohjola & Koistinen,2002]. The correction for partial beam-filling is under further study.
To summarize above the algorithm is for
- non-polarimetric measurements
- stratiform rain case
- for low elevation angles, when melting layer is located on the ground
- dependent on particle habit (density) at top of the melting layer in the case of A-R relation.
b) Amount of validation performed so far
The estimated relations are at the moment still in research stage. The estimated specific attenuation is in agreement with earlier research, but the validation is done only in demonstrative level to one representative case with the Kumpula C-band dual-pol Doppler radar on December 10, 2011 (Figure 1). In this case the top of the melting layer was at an altitude of 350 m, and the melting layer was located close to the ground as observed from the decrease of the co-polar correlation coefficient. In this case the Aave-zmax relation of the rimed case is applied to the measured PPI to estimate the existing attenuation. This selection is motivated by the observations of the reflectivity factor values above the melting layer. One can see, for example, from RHI measurements in Figure 1.that these reflectivity factor values exceed 35 dBZ in some parts of the profile. Generally, 35 dBZ is considered to be a threshold value between low density snow aggregates and heavily rimed particles like graupel and, therefore, the use of the formula for the rimed case is justified. Figure 2. shows that the computed maximum attenuation at a distance of 40 - 50 km is around 8 dB, and the location can be identified to be in the direction of the maximum reflectivity factor values.
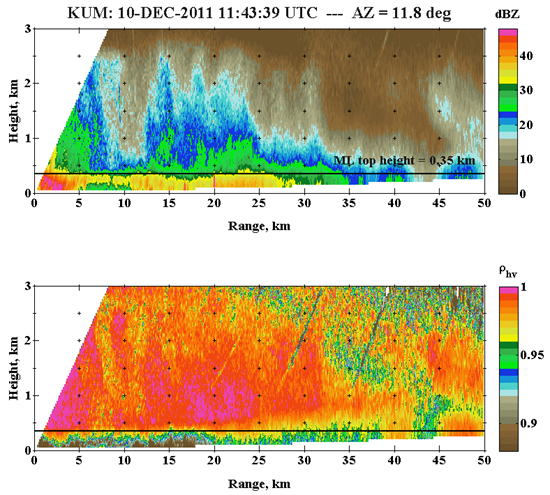
Figure 1. Low melting layer case for verification of attenuation algorithm.

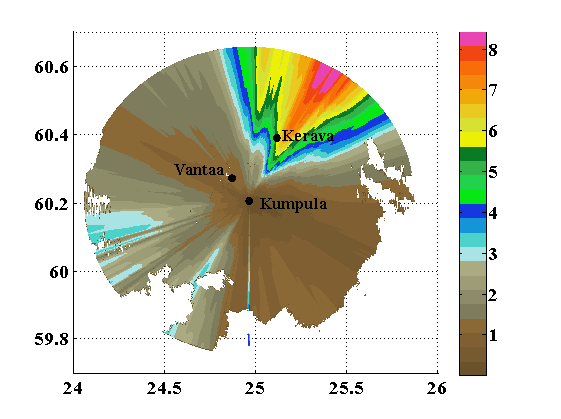
Figure 2. PPI of the test case and the estimated maximum PIA of the rimed relation.
To verify this result a Kerava C-band radar measurements were used. The measurements were carried out at 1.5 degree elevation and occur 2 minutes after Kumpula observations. The Kerava PPI plot in wgs84 coordinates is shown in Figure 3. Kerava radar is located 22 km from Kumpula 95 m above the mean sea level. At the time of Kumpula observations the melting layer is on the ground the whole range from Kumpula to Kerava, and the calculated maximum attenuation is in the direction of Kerava radar. By comparing attenuated Kumpula observations to nearly unattenuated Kerava measurements, we can verify performance of the derived relations. A part of the range profile of a scan from Kumpula to Kerava with an azimuth angle of 22deg is depicted in Figure 4. At this range, the Kerava radar beam is still inside the melting layer and coincides with the Kumpula radar beam, although the Kumpula beam is no longer fully inside the melting layer. The diameter of the Kumpula radar beam is around 450 m, whereas the diameter of the Kerava radar beam is around 30 m, which causes some error and discontinuity in this analysis. One other potential error source is the radar calibration, it is estimated to be in the order of 1 dB and should not effect the analysis. The resolution of the Kumpula radar PPI is 100 m; for Kerava, it is 500 m. They are compared with measured reflectivity factor difference (Figure 4). The estimated attenuation computed with the relation of the rimed snow for the averaged specific attenuation as a function of maximum reflectivity factor seems to follow the average of the two-way attenuation well. Further away from Kerava, the effect of the melting layer attenuation on the Kerava radar beam is also seen in the range profile.
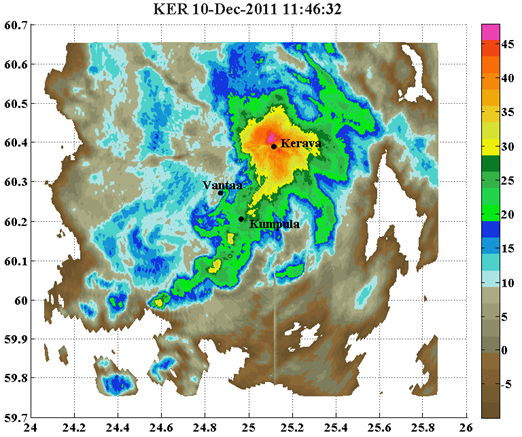
Figure 3. Reflectivity factor of Kerava radar measured with 1.5 degree elevation
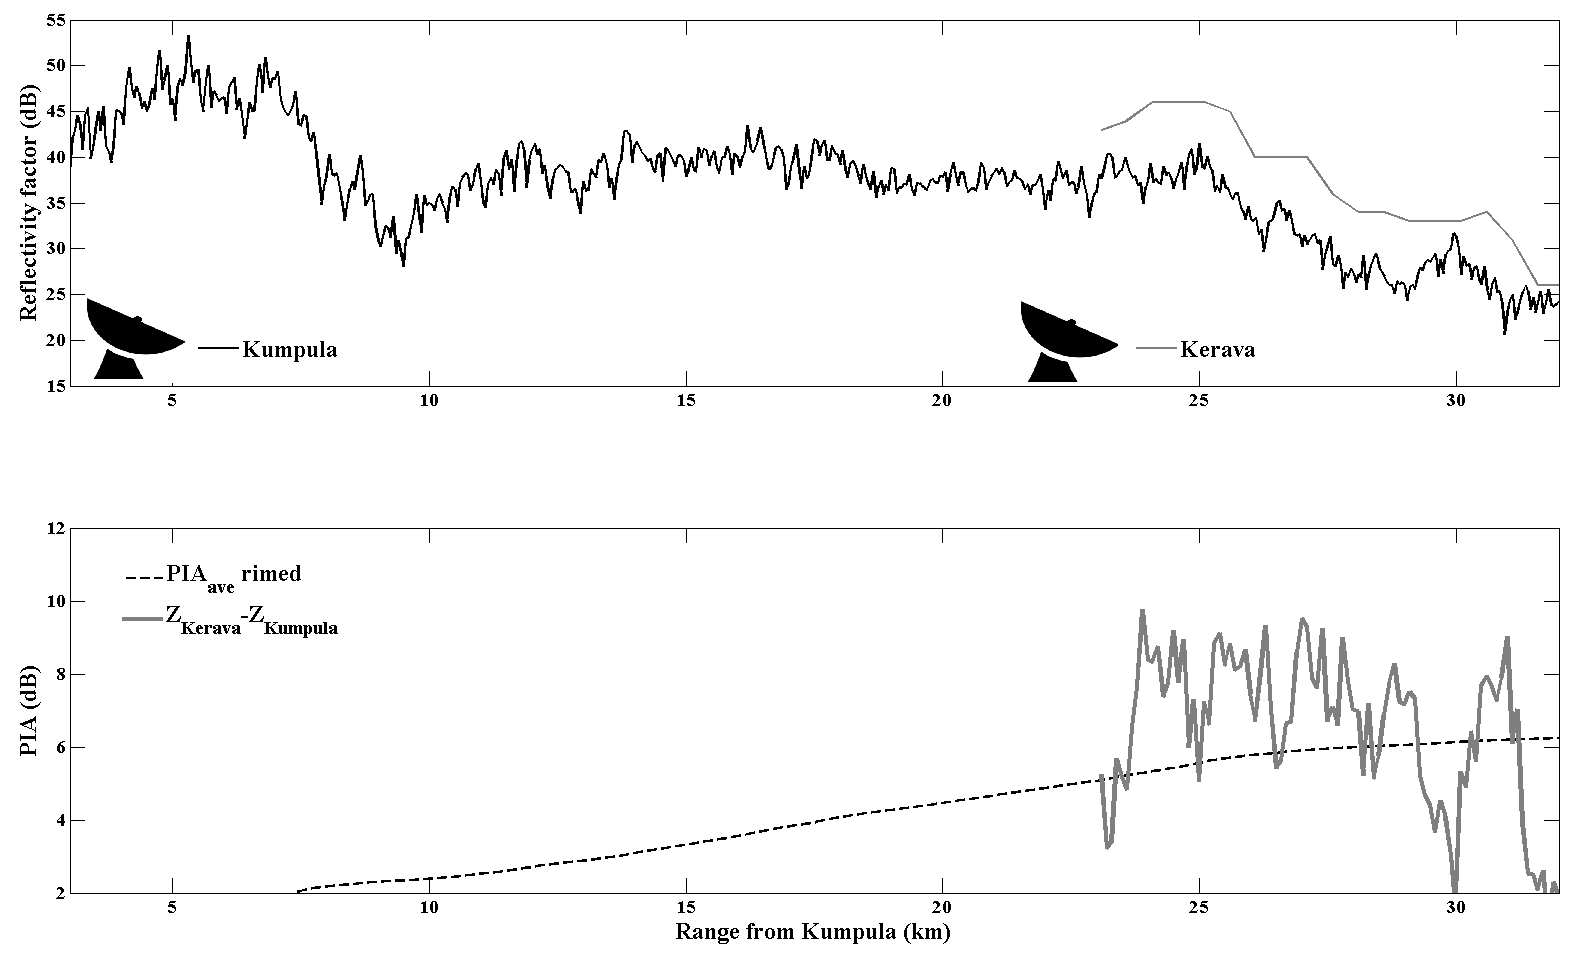
Figure 4. Comparison of reflectivities measured with Kumpula and Kerava radar and the estimated PIA with all of the defined relations.
c) References (names and contact information of all developers during the evolutionary history, scientific papers)
The algorithm is presented in von Lerber A.,Moisseev D., Leinonen J., Koistinen J. and Hallikainen M.,”Modeling Radar Attenuation by a Low Melting Layer With Optimized Model Parameters at C-band”, IEEE Transactions on Geoscience and Remote Sensing, under review.
H.Pohjola and J.Koistinen, Diagnostics of reflectivity profiles at the radar sites, in Proceedings on the 2nd European Conference on Radar Meteorology in Delft, Netherlands, vol. 1, November 2002, pp. 233-237.
3. ODIM metadata requirements for I/O
4. Input data
a) What kind of radar data (including the list of previous algorithms and quality flags applied)
The description using A-zmax relation.
The input is PPI DBZH of low elevation without any attenuation corrections.
To define the the rain case to follow the restrictions of the algorithm, the needed input is taken from BBAND_FROM_VPR algorithm.
b) Other data (optional and mandatory, applying “universally” agreed formats, geometry)
5. Logical steps, using any of: text, flow charts, graphics, equations (or references to equations), conditional branches in “all possible cases”.
Description of algorithm is depicted in Figure. 5.
First define that the case is suitable as the estimate is applicable to a stratiform case of a low melting layer. At the moment it is done by observations, though there does exists e.g. classification of convective and stratiform rain in Iris.
- Define the extent the stratiform case with observations
- Define the height of the melting layer top, approximately at 500 m from BBAND_FROM_VPR
If these criteria are full-filled:
- Define the original snow habit from the reflectivity factor difference at maximum and in rain. Limits are approximately following (F.Fabry and I.Zawadzki, “Long-term radar observations of the melting layer of precipitation and their interpretation”, Journal of the Atmospheric Sciences, vol. 52, pp. 838851, 1995), by assuming when the difference is larger than 10 dB, the snow habit to be low-density aggregates and when the difference is smaller than 10 dB the habit to be rimed particles. This applies more to A-R relation.
The estimate is applied to a low elevation angle PPI of horizontal reflectivity factor without any attenuation correction, but the noise values are excluded with threshold value. As the estimate is modeled to an unattenuated melting layer profile, it must be iteratively applied to the original PPI DBZH.
- Apply chosen relation to PPI reflectivity factor values and calculate the two-way path integrated attenuation (PIA). Add it to the original DBZH and compare at selected areas whether the estimated attenuation is accurate enough. If not, apply the defined relation a second time, calculate the PIA attenuation and compare to the original estimate. This process iteratively approaches the accurate enough estimate. In our example the iteration had 4 rounds, but already 2 gives quite accurate estimate.
The output is the estimated attenuation and this can be added to the PPI dBZH.
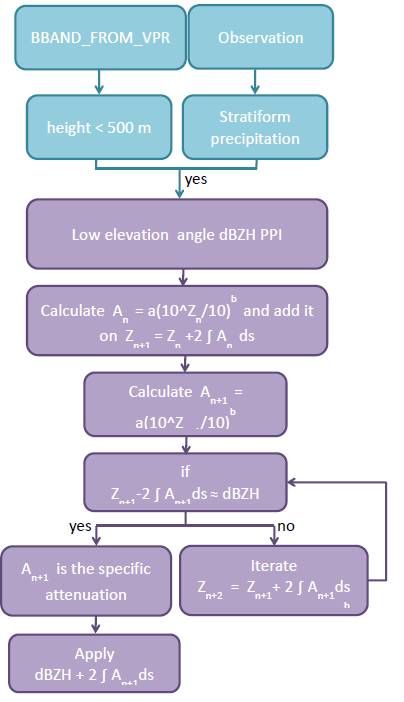
Figure 5. Schematic description of the algorithm
6. Output.
a) Data type using ODIM notation where possible, e.g. DBZH
Output is PPI dBZH with attenuation estimate or attenuation estimate separately. Note this algorithm is still under development.