BALTRAD
1. Algorithm name
Probability of beam overshoot / detection range analysis
2. Basic description
a) Physical basis of the algorithm
The radar ”sees” precipitation only until a certain maximum range, which is dependable of:
- Scanning geometry (mainly lowest elevation, but also radar height and beam blocking)
- Sensibility of radar
- Refractivity of atmosphere
- Height of precipitative clouds (TOP)
The effects of geometry are known and stay constant. Refractivity changes are difficult to determine exactly and are ignored in this development. This algorithm tackles the last unknown, cloud top height. In non-convective precipitation, it is assumed to remain the the same for some hours, but it varies a lot from case to case. This algorithm is designed mainly for frontal precipitation in winter conditions.
b) Amount of validation performed so far
- The method has been in operational use in FMI for road maintenance authority since 2007
c) References
- Operational work: FMI, Development of services
3. ODIM metadata requirements for I/O
- Top-level “where”: latitude, longitude
- Top-level “how”: beamwidth
- Top-level “what”: date,time
- Dataset-specific “where”: elangle, rstart, nbins, nrays, rscale, rstart
- Data-specific “what” : quantity, gain, offset, nodata, undetect
4. Input data
a) What kind of radar data (including the list of previous algorithms and quality flags applied)
- quantity=DBZH, full polar volumes
The non-precipitating echoes should be removed by using e.g. AnDRe of Rack. Possible holes generated to the data doesn’t matter in this analysis.
5. Logical steps, using any of: text, flow charts, graphics, equations (or references to equations), conditional branches in “all possible cases”
Radial TOP search. Valid TOP values (over dBZ threshold, default value -4) of each radial are sorted first
- The highest part of TOP values are selected (parameter HIGHPART, default value 0.1 (10%))
- If the amount is less than wanted, only those are selected
- From sorted values left, the wanted point of distribution is chosen, parameter called SAMPLEPOINT, default value 0.5 (median, zero would be pointing to the highest one)
- The weight factor (Wray) for this ray will then be the relation between valid values and the amount of pre-selected values indicated by HIGHPART

The final radial TOP value is calculated from:
TOPrad = WrayTOPray + (1-Wray)*TOPprev *
Where the TOPprev is the median of highest 10% radial TOP values from previous TOP analysis.
- Anyhow, new TOPprev is not saved, if there are less than 10% of valid radial TOPs of all radials.
- In this case, if the age of TOPprev is more than two hours the TOPprev value is going to converge towards climatological value (5.5 km in Finland) during following 48 hours.
Weighted sector smoothing
The valid radial TOPrads having weights of Wray are averaged linearly over azimuthal smoothing sector (parameter AVERAGING_SECTOR, default value 60 degrees), so that the highest sector weight (1) is at the middle of the sector and zero just outside the sector
Radial range analysis
- The next step is to calculate the ranges where the effective edges of lowest elevation beam hits the analysed and smoothed TOP.
- Between these ranges the beam overshooting increases from none to full and detectability is supposed to decrease from full to none.

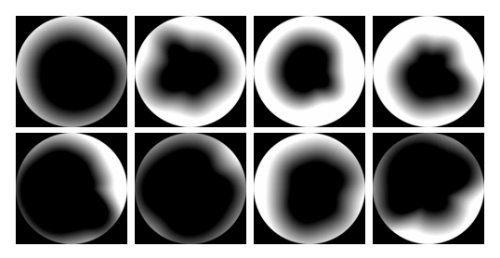
Finally we should have a detectability field in polar coordinates per each radar of the network. This can also be called the probability of beam filling.

6. Output
-
quantity=PROB (polar or cartesian geometry) of beam overshooting P(overshoot) = 1 - P(detection)
-
Optionally the desired detection range(s) based on detection probability threshold(s), visualization of the zone of uncertain detection.