BALTRAD
1. Algorithm name
Separation of convective and stratiform precipitation – CONVECTION
2. Basic description
a) Physical basis of the algorithm
The algorithm categorizes each radar pixel into convective or stratiform one employing fuzzy logic approach with multi-source meteorological input data.
b) Amount of validation performed so far
Prototype was developed and tested in the frame of grant awarded by Polish Ministry of Science and Higher Education (2009-2012)
c) References (names and contact information of all developers during the evolutionary history, scientific papers)
- IMGW, Department of Ground Based Remote Sensing.
- Scientific paper: Jurczyk, A., Szturc, J., and Ośródka, K., 2012. Convective cell identification using multi-source data. IAHS Publ., no. 351, 360-365.
3. ODIM metadata requirements for I/O
*Input data *
If input data: object=PVOL
- General “what”: source(NOD).
- For particular SCANs:
- Dataset-specific “where” for data and QI: nbins, nrays.
- Data-specific “what” for data: gain, offset, nodata, undetect.
- Data-specific “what” for QI: gain, offset, nodata, undetect.
If input data: object=IMAGE
- Top-level “what”: object, data, time.
- “Where”: lon, lat, projdef, xsize, ysize, xscale, yscale, LL_lon, LL_lat, UL_lon, UL_lat, UR_lon, UR_lat, LR_lon, LR_lat.
- Dataset-specific “what” for data: product.
- Data-specific “what” for data: gain, offset, nodata, undetect.
- Data-specific “what” for QI: gain, offset, nodata, undetect.
Output data: Cartesian data
- Top-level “what”: object, data, time.
- “Where”: lon, lat, projdef, xsize, ysize, xscale, yscale, LL_lon, LL_lat, UL_lon, UL_lat, UR_lon, UR_lat, LR_lon, LR_lat.
- Dataset-specific “what” for data: product.
- Data-specific “what” for data: gain, offset, nodata, undetect.
- Data-specific “what” for QI: gain, offset, nodata, undetect.
4. Input data
a) What kind of radar data (including the list of previous algorithms and quality flags applied)
- object=PVOL (quantity=DBZH/TH) or three object=IMAGE: product=MAX (quantity=DBZH), VIL (quantity=VIL), ETOP (quantity=HGHT).
b) Other data (optional and mandatory, applying “universally” agreed formats, geometry)
- Meteosat products: Cloud Type; Overshooting Tops.
- Lightning detection data: Number of cloud-to-ground lightning.
- NWP model data: Convective Available Potential Energy (CAPE); Total Totals Index (TTI).
5. Logical steps, using any of: text, flow charts, graphics, equations (or references to equations), conditional branches in “all possible cases”.
The algorithm for separation of convective and non-convective precipitation is based on multi-source meteorological data.
Algorithm parameters
*Table 1. *Set of the algorithm parameters (for standard version)
| Description | Denotation | Default value |
| Preliminary threshold for convection (dBZ) | ThresholdConv | 25 |
| Lower threshold for convection area (km^2^) | ThresholdAreaConv | 4 |
| Weight for member function of MAX for C class in fuzzy logic scheme | MaxPar_weightC | 0.3 |
| Weight for member function of MAX for S class in fuzzy logic scheme | MaxPar_weightS | 0.3 |
| Weight for member function of MAXDiff for C class in fuzzy logic scheme | MaxDiff_weightC | 0.4 |
| Weight for member function of MAXDiff for S class in fuzzy logic scheme | MaxDiff_weightS | 0.4 |
| Weight for member function of ETOP for C class in fuzzy logic scheme | EtopPar_weightC | 0.15 |
| Weight for member function of ETOP for S class in fuzzy logic scheme | EtopPar_weightS | 0.15 |
| Weight for member function of VILDiff for C class in fuzzy logic scheme | VilDiff_weightC | 0.15 |
| Weight for member function of VILDiff for S class in fuzzy logic scheme | VilDiff_weightS | 0.15 |
| Radius for MAXDiff and VILDiff determination (km) | ConvRadius | 11 |
| Code for convective pixels (between 1 and 255) | CodeC | 2 |
| Code for stratiform (non-convective) pixels (between 1 and 255) | CodeS | 1 |
Input data
Table 2. The list of the algorithm input data (selected empirically).
| Input data | Units | Description |
| Weather radar products | ||
| Maximum of reflectivity (Z) | dBZ | Product: MAX(Z) – Maximum. Display range of height: 1–15 km |
| Height of radar echo top (ET) | km | Product: EHT(Z) – Echo Height. Echo threshold: 4 dBZ |
| Water content in atmosphere (VIL) | mm | Product: VIL – Vertically Integrated Liquid. Range of height: 1–10 km |
| Weather radar-based parameters | ||
| Difference of reflectivity (Δ_Z = Zmax / Zmean) | dBZ | Calculated from MAX(Z) radar product |
| Difference of VIL (Δ_VIL = VIL / VILmean_) | mm | Calculated from VIL radar product |
| Meteorological satellite products | ||
| Cloud Type (CT) | (classes) | EUMETSAT product |
| Overshooting Tops (OTS) | K | EUMETSAT product |
| Lightning detection system products | ||
| Cloud-to-ground lightning (CG) | (number) | Calculated from reports generated every 1 minute that include data about each lightning |
| Numerical weather prediction products | ||
| Convective Available Potential Energy (CAPE) | J kg^-1^ | Based on thermodynamic diagram |
| Total Totals Index (TTI) | °C | Based on thermodynamic diagram |
The radar data are mandatory for the algorithm correct running. The two options of input data set are available:
- option standard: using only radar data as input (five first parameters from Table 2),
- option standard+: using all set of input data (Table 2) - to be implemented.
Separation of onvective and non-convective precipitation
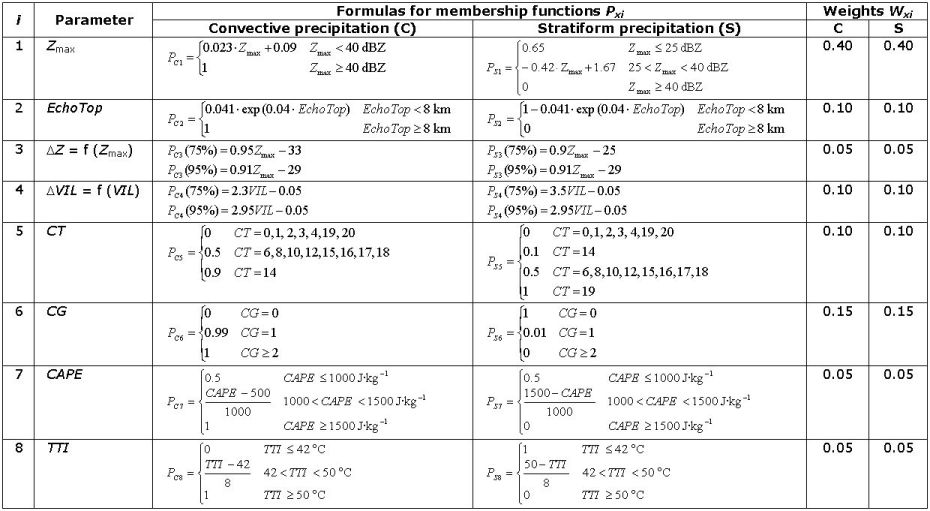
The identification of convection areas is performed by fuzzy logic approach, which is applied to categorize each radar pixel into convective or non-convective precipitation (classes: non-convective S, or convective C). For the both classes membership functions are defined for all selected parameters. Then the functions are aggregated as weighted sums:
where: x’’ is the precipitation class (S or C); ‘‘i’’ is the parameter number; ‘‘n’’ is the number of the parameters; ‘‘Pxi’’ is the membership function for ‘‘i’‘-th parameter; ‘‘Wxi’’ is the weight of ‘‘i-th parameter. Comparison of the weighted sums for both classes decides which category S or C a considered radar pixel belongs to.
The membership functions were determined on Polish meteorological data set from 2007 and 2013. The whole data set was labelled by hand as convective or non-convective areas, which was done by meteorologist from forecast office as a human expert. In this way two data subsets were created with all parameter values, and then membership functions were empirically established for all parameters.

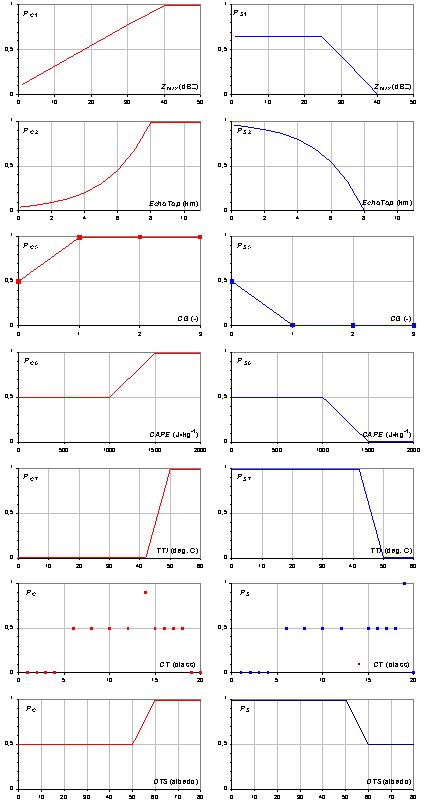
Two kinds of the functions were employed: one- and two-dimensional (1-D and 2-D), the latter for the parameters that are calculated from two other ones (i.e. Δ_Z’’ and Δ’‘VIL_).
The 1-D membership functions were obtained from analyses of scatter diagrams for the particular parameters (Fig. 1), which allowed to determine threshold values above or below which the values of relevant membership functions are attributed to 0 or 1, and linear or another approximation of the function values within the range (0, 1).

Fig. 1. One-dimensional membership functions for convective (on the left) and stratiform (on the right) precipitation.
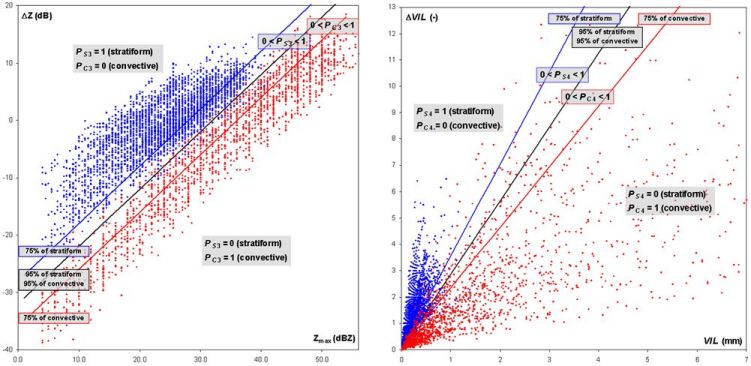
The 2-D membership function is defined not for single parameter but for two parameters analysed jointly: (Δ_Z’’, ‘‘Z’’) and (Δ’‘VIL’’, ‘‘VIL_). Membership functions for C and S classes were determined in dependence on certain percentiles empirically estimated on historical data. The uncertainty area was assumed to lay between 5% and 25%-percentiles of all parameters’ pairs gathered in appropriate data subset, as it is presented in Fig. 2. For values below 5% and above 25%-percentile values of membership functions were assigned to 0 and 1 respectively, whereas for values between 5% and 25%-percentile values of membership function are linearly interpolated in range from 0 to 1 taking distances to the both percentiles into account. In our case for two investigated 2-D membership functions it turned out that 5%-percentiles for convective and non-convective classes are so close each other that they were approximated by the common one.

Fig. 2. Two-dimensional membership functions for ‘‘Δ’‘Z (on the left) and ‘‘Δ’‘VIL (on the right).
Quality characterization
Map of quality index (QI) will be calculated for the output field. The QI will be determined based on comparison of PC’’ and ‘‘PS - sums of membership functions for thw two classes: convective and non-convective precipitation.
6. Output
a) Data type using ODIM notation where possible, e.g. DBZH
Output quantity CLASS (convective/non-convective precipitation) as IMAGE object (in Cartesian coordinates) with:
- “how”: task - “pl.imgw.product2d.convection”,
- “how”: task_args - parameters of CONVECTION algorithm.
b) Quality index (QI) field
Quality index field QIND as IMAGE object with:
- “how”: task - “pl.imgw.product2d.convection”,
- “how”: task_args - parameters of CONVECTION algorithm.
7. Outline of a test concept exemplifying the algorithm, as a suggestion for checking that an implementation has been successful.
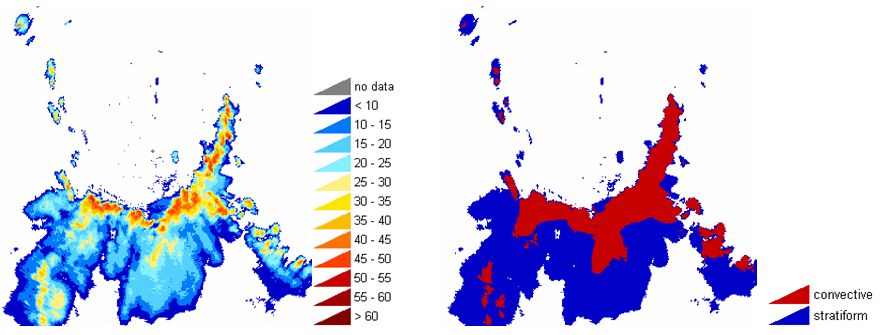
Example of radar reflectivity field in dBZ (on the left) and detected area of convective and startiform precipitation (on the right) for Legionowo radar (12 August 2007, 14 UTC):
