BALTRAD
1. Algorithm name
Quality-based Echo Top (ETOP) product generation – Product2D: ETOP
2. Basic description
a) Physical basis of the algorithm
The algorithm generates Echo Top (ETOP) 2-D product from radar reflectivity volume with quality information using product2D_PPI algorithm.
b) Amount of validation performed so far
Not performed yet.
c) References (names and contact information of all developers during the evolutionary history, scientific papers)
IMGW, Department of Ground Based Remote Sensing.
3. ODIM metadata requirements for I/O
Input data: VOL
- General “what”: source(NOD).
- For particular SCANs:
- Dataset-specific “where” for data and QI: nbins, nrays.
- Data-specific “what” for data: gain, offset, nodata, undetect.
- Data-specific “what” for QI: gain, offset, nodata, undetect.
Output data: Cartesian data
- Top-level “where”: lon, lat, xsize, ysize, xscale, yscale.
- Dataset-specific “what”: product.
- Data-specific “what” for data: gain, offset, nodata, undetect.
- Data-specific “what” for QI: gain, offset, nodata, undetect.
4. Input data
a) What kind of radar data (including the list of previous algorithms and quality flags applied)
object=PVOL:
- quantity=DBZH, otherwise TH,
- quantity=QIND (generated e.g. by QI_TOTAL algorithm).
b) Other data (optional and mandatory, applying “universally” agreed formats, geometry)
Defined projection and domain of Cartesian output.
5. Logical steps, using any of: text, flow charts, graphics, equations (or references to equations), conditional branches in “all possible cases”.
The algorithm generates Echo Top (ETOP) 2-D products in Cartesian coordinates from radar reflectivity volume and based on the data quality information.
Algorithm parameters
Set of the algorithm parameters:
| Description | Denotation | Unit | Default value |
| Lower height limit for ETOP product generation | ETOP_hMin | km | 1 |
| Upper height limit for ETOP product generation | ETOP_hMax | km | 20 |
| Minimum cloud reflectivity | ETOP_ZMin | dBZ | 4 |
Algorithm description
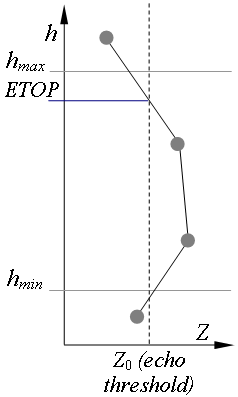
Echo Top (ETOP) product represents Cartesian image of height of echo (cloud) tops defining cloud boundary with proper level of radar reflectivity Z0 (in dBZ) (Fig. 1). The ETOP (in km) is detected in a preset range of height (between hmin and hmax) and generally is calculated by interpolation of reflectivity Z between two highest gates for which the reflectivity passes Z,,0,, value. If searched height of Z0 value is between two measurements Z’ and Z” detected at heights h’ and h” respectively, then in order to find the height hint at which echo top occurs (Z = Z0) the linear interpolation is applied:
In case when both considered measurements are with echo (Z ≥ Z0) then _hint_ = min (hmax, max (h’, h”)).

Fig. 1. Scheme of generation of radar Echo Top product (ETOP).
There are considered only measurements (Cartesian pixels on PPIs) between h,,min,, and h,,max,,, and two closest ones (below hmin and above hmax). At first, height h of the highest measurement with echo (Z ≥ Z0) is found.
The following cases may occur:
- h > hmax and lower measurement exists, then echo top hint is interpolated from the two measurements, and:
- if hint > hmax then ETOP = “undetect” and lower echo (Z ≥ Z0) is analyzed if exists,
- if hint <hmax.
-
h > hmax and lower measurement does not exist, then ETOP = “nodata”.
- h <= hmax and higher measurement exists, then echo top hint is interpolated from the two measurements, and:
- if hint ≥ hmin then ETOP = min (hint, hmax),
- if hint < hmin then ETOP = “undetect”.
- h <= hmax and higher measurement does not exist, then:
- if h ≥ hmin then ETOP = h,
- if h < hmin then ETOP = “nodata”.
Otherwise, i.e. echo (Z ≥ Z0) is not found, then:
- if there so no measurement between hmin and hmax then ETOP = “nodata”,
- else ETOP = “undetect”.
Data quality characterization
Quality of the ETOP depends on the two factors:
- quality of reflectivity data from which ETOP was determined, QIsource,
- how large fraction of investigated heights (between hmin and hmax) was scanned, QIscope,
and the final quality index QI is taken as a product of the both factors:
The value of the first component QIsource is taken as the quality of the measurement defining echo top, and in case of interpolation from two measurements the minimum quality is chosen. If ETOP “nodata”, and if ETOP 1.

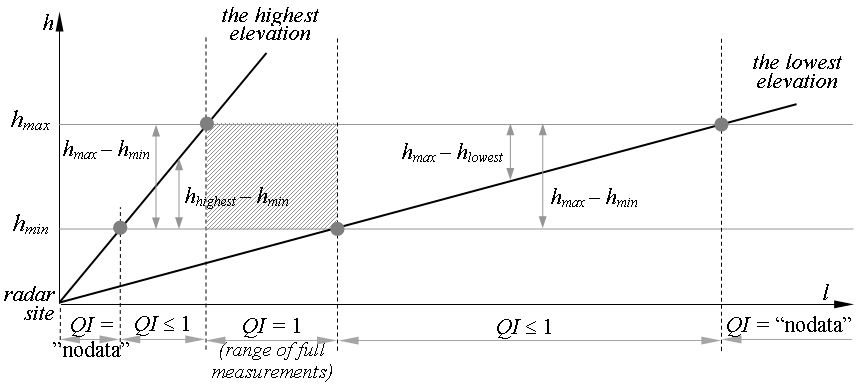
Fig. 2. Quality characterization for Echo Top product in terms of availability.
The second component QIscope is determined based on heights of the highest and lowest scans for considered Cartesian pixel (hhighest and hlowest respectively) in relation to hmin and hmax (Fig. 2):
-
if hhighest < hmin then
_ QI scope _ “nodata”.
-
if hhighest ≥ hmin and hlowest <= hmax then QIscope depends on what part of height range between hmin and hmax was scanned:
but if (_ hhighest_ > hmax ) and (ETOP <> “undetect”) then QIscope = 1.
-
if hlowest > hmax then
QIscope “nodata”.
6. Output
a) Data type using ODIM notation where possible, e.g. DBZH
Input quantity as IMAGE object (in Cartesian coordinates) with:
- “how”: task - “pl.imgw.product2d.etop”,
- “how”: task_args
- parameters inherited from PPI algorithm (interpolation method and selected quality field name),
- parameters of ETOP algorithm,
b) Quality index (QI) field
Quality index field QIND as IMAGE object with:
- “how”: task - “pl.imgw.product2d.etop”,
- “how”: task_args - parameters inherited from PPI algorithm (interpolation method and selected quality field name).
7. Outline of a test concept exemplifying the algorithm, as a suggestion for checking that an implementation has been successful.
TBD