BALTRAD
1. Algorithm name
Dynamic R(Z) using single-polarisation data and ground observations
2. Basic description
a) Physical basis of the algorithm
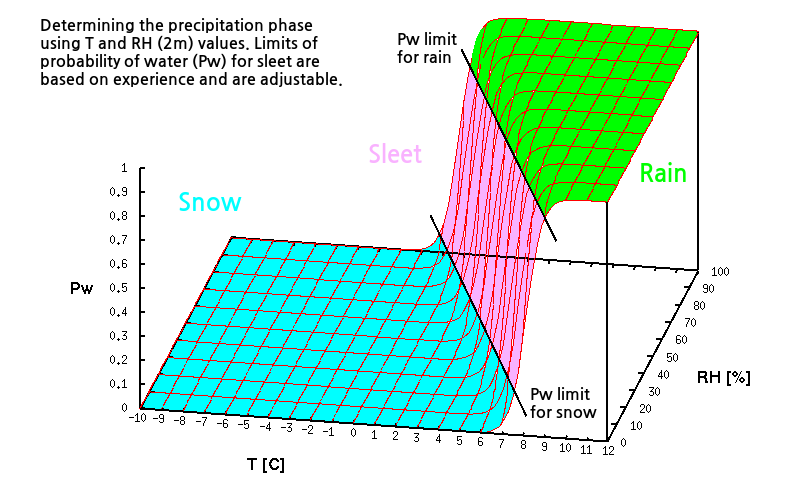
- The algorithm is based on estimating the thermodynamical phase of precipitation which depends on both temperature T and relative humidity RH at ground level (2 meter height). When air is dry, the evaporation cools snowflakes so that melting doesn’t occur until temperature of surrounding air reaches about 7 C.
The equation for probability of precipitation being water phase
Where units are T[C] and RH[%]
-
This equation is determined using a statistical model [1].
-
In practice the temperature and relative humidity are taken from observation or model source (e.g. kriging-analysed ground observations) and interpolated spatially to corresponding radar data grid and temporally between observation, analysis or forecast times to match the radar data acquisition time.
-
The probability of water is then thresholded for rain and snow (typically 95 % and 5 %), and corresponding Z(R) and Z(S) relations are used for radar data. Sleet is handled as an linear interpolation between parameters A and b of the relations.

- If VPR correction is available, the conversion is performed for dBZ-values corrected to ground level.
b) Amount of validation performed so far
- The method has been in operational use in FMI since 1999 [2]
c) References
- Operational work: FMI, Development of services
- Scientific papers:
- [1] Koistinen, J. and Saltikoff, E., 1999 Experience of customer products of accumulated snow, sleet and rain. COST75, Advanced weather radar systems, International seminar, Locarno, 397–406.
- [2] Saltikoff, E., Koistinen J. and Hohti, H., 2000: Experience of Real Time Spatial Adjustment of the Z-R Relation According to Water Phase of Hydrometeors. Phys. Chem. Earth (B), Vol. 25, No. 10-12 pp. 1017–1020.
3. ODIM metadata requirements for I/O
- Top-level “where”: latitude, longitude
- Top-level “how”: beamwidth
- Top-level “what”: date,time
- Dataset-specific “where”: elangle, rstart, nbins, nrays, rscale, rstart or geometry attributes if cartesian data
- Data-specific “what” : quantity, gain, offset, nodata, undetect
4. Input data
a) What kind of radar data (including the list of previous algorithms and quality flags applied)
-
quantity=DBZH
-
Surface analysis of 2m temperature (T2m) and relative humidity (RH2m) converted to radar grid
-
VPR correction for used datasets if available (vector of correction values per elevation), or if composite is used, the cartesian VPR correction field.
5. Logical steps, using any of: text, flow charts, graphics, equations (or references to equations), conditional branches in “all possible cases”
- Decide the Pw limits for sleet and interpolate Z(R) relation parameters once (to lookup table)
- Calculate the water phase probability Pw field from T2m and RH2m fields
- Interpolate Pw field to radar grid.
- Interpolate (and extrapolate if needed) in time to match radar data times.
- Apply VPR correction to radar data if available
- Apply the phase dependent R(Z) to DBZH data which is considered to represent surface value
When visualizing the data, using phase dependent color map is useful, because people senses same intensity of snow and rain being not the same.
6. Output
-
quantity=RATE (polar or cartesian geometry)
-
Optionally the classification rain/sleet/snow and the Pw field as quantity=PROB